Direct Emissions and Energy Indirect Emissions (Scopes1 and 2)
To address global climate change and respond to the Paris Agreement's requirement for countries to submit climate action commitments, Taiwan has announced its long-term national greenhouse gas reduction target of achieving net-zero emissions by 2050. In line with this, Primax Group has committed to achieving net-zero emissions by 2050 and has developed a net-zero pathway. Reduction targets have been established using the scientific methodologies defined by the Science Based Targets initiative (SBTi). Policies and reduction plans are systematically developed and implemented. To align with the approved SBTi 1.5° C net-zero target, the baseline year for Scope 1 and Scope 2 greenhouse gas emissions has been adjusted to 2023.
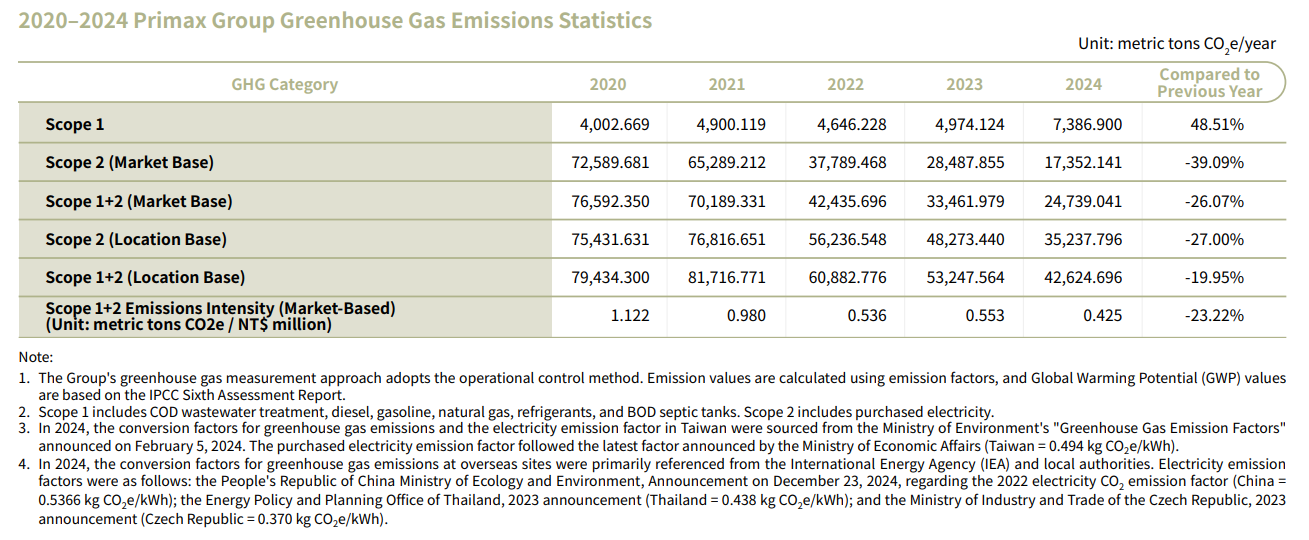
According to the GHG inventory results over the years, the major sourcesof Scope1 and Scope2 GHG emissions primarily refer to Scope2 (over 90%by region or over 85% by market). Therefore, Primax's GHG reduction policy focuses on energy management primarily, and then implementation of renewable energy.
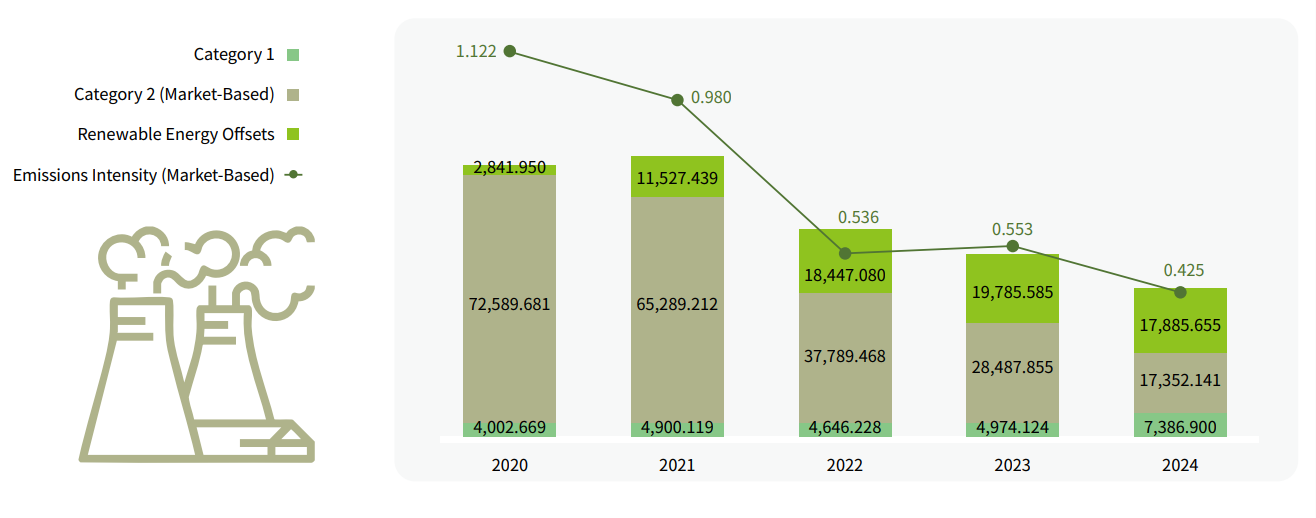
In 2024, Primax Group's Scope 1 and 2 greenhouse gas emissions totaled 24,739.0 metric tons CO2e per year (market-based), representing a reduction of 8,722.9 metric tons CO2e per year, or approximately 26.07%, compared to the 2023 baseline year. Since 2023, Primax Group has already achieved its original 2030 target of reducing greenhouse gas emissions by 60% (market-based) ahead of schedule. In 2024–2025, through the establishment and submission of SBT net-zero targets, the Group reset its greenhouse gas reduction targets, continuing to set higher standards and expectations for its progress toward net-zero emissions. Scope 1 and Scope 2 emissions were verified by SGS, in accordance with ISO 14064-3:2019 issued by the International Organization for Standardization (ISO). The verification opinion was a reasonable assurance level with an unqualified conclusion.
The greenhouse gas emission intensity in 2024 was 0 . 553 tonne CO2e/million NTD, a decrease by 3.30% compared with 2022 and a decrease by 67.21% compared with the base year of 2019 . In 2023 , the increase in greenhouse gas emission intensity compared to the previous year was mainly due to the inclusion of the emissions of Tymphany plant in Czech Republic and the decrease in the Group's turnover.
In 2023 , the renewal energy certificate offset against 36 , 310 , 000 kWh and 19 , 785 . 585 tonne CO2e, accounting for 40.30% of the electricity consumption.From 2019 to the end of 2023 , the cumulative purchase of Renewable Energy Certificates offset against a total of 57 , 192 . 133 tonne CO2e.


Other indirect emissions (Scope 3)
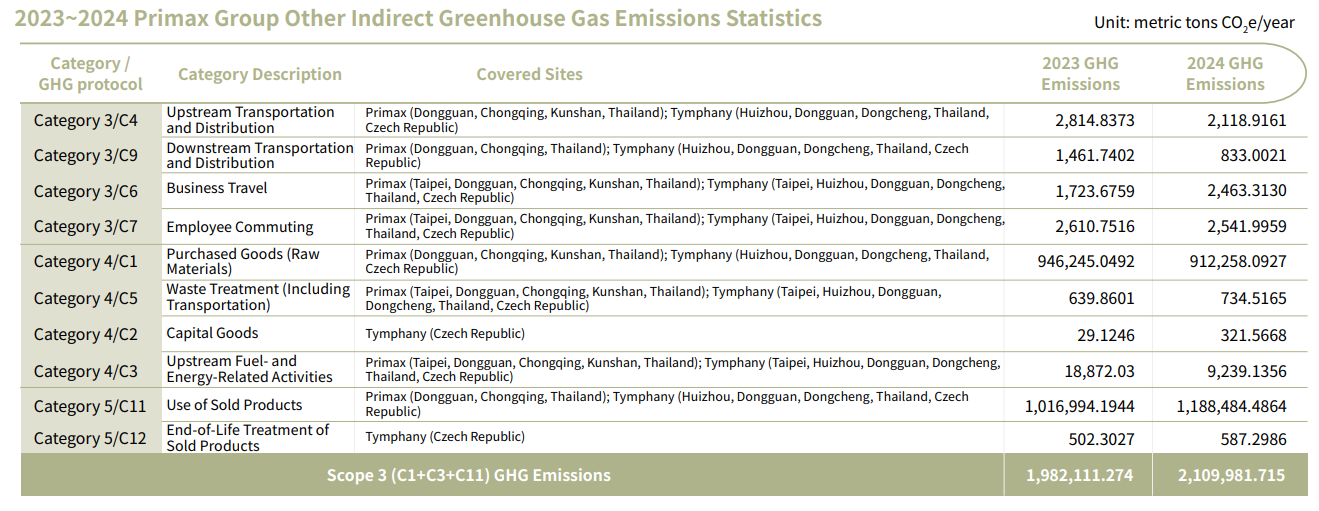
In addition to calculating greenhouse gas emissions from significant sources in accordance with ISO 14064-1:2018, Primax also measures various categories of indirect emissions following the GHG Protocol methodology. In 2023, Primax implemented a carbon management system to systematically collect and consolidate large volumes of Scope 3 data. This year's inventory scope was expanded to include Tymphany (Czech Republic), and additional categories not covered in 2022, such as employee commuting, capital goods, and end-of-life treatment of sold products. The year 2023 was established as the baseline year for Scope 3 emissions.
Considering the value chain upstream and downstream, Categories 1, 3, and 11 were identified as the relevant and material Scope 3 emission sources. Accordingly, Scope 3 reduction calculations will be based on the combined emissions of Categories 1, 3, and 11. Scope 3 data were verified by SGS in accordance with ISO 14064-3:2019 issued by the International Organization for Standardization (ISO). The verification opinion was a limited assurance level with an unqualified conclusion.


